Can you trace every single request end-to-end in your system right now?
I had a really interesting conversation with a friend this week that left me thinking about something we all struggle with in complex systems: observability.
Most teams still rely on logs, counters, and P95 charts… and hope for the best.
But in modern, distributed architectures, that simply isn’t enough.
To illustrate, think about something as common as an email processing pipeline, and this applies far beyond email:
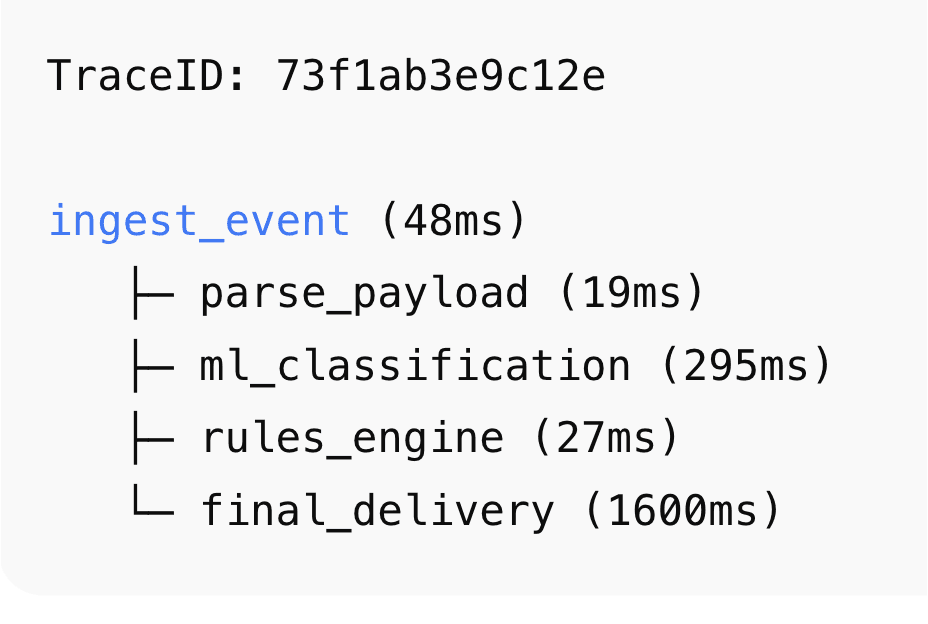
𝘊𝘰𝘮𝘱𝘭𝘦𝘹 𝘸𝘰𝘳𝘬𝘧𝘭𝘰𝘸𝘴 𝘢𝘳𝘦 𝘣𝘭𝘢𝘤𝘬 𝘣𝘰𝘹𝘦𝘴 𝘸𝘪𝘵𝘩𝘰𝘶𝘵 𝘳𝘦𝘢𝘭 𝘵𝘳𝘢𝘤𝘪𝘯𝘨
• an ingestion layer
• parsers and normalizers
• multiple ML or threat-detection services
• a rules or compliance engine
• delivery or downstream queue
• logging + analytics
That’s 5-10+ microservices, all with their own logs, metrics, and failure modes.
𝘚𝘰 𝘸𝘩𝘦𝘯 𝘴𝘰𝘮𝘦𝘵𝘩𝘪𝘯𝘨 𝘨𝘰𝘦𝘴 𝘸𝘳𝘰𝘯𝘨, 𝘭𝘦𝘢𝘥𝘦𝘳𝘴 𝘰𝘧𝘵𝘦𝘯 𝘩𝘦𝘢𝘳 𝘲𝘶𝘦𝘴𝘵𝘪𝘰𝘯𝘴 𝘭𝘪𝘬𝘦:
“Why did this request take 3 seconds instead of 300 ms?”
“Which service slowed it down?”
“Did it get stuck? Did it fail quietly? Where?”
𝘛𝘳𝘢𝘥𝘪𝘵𝘪𝘰𝘯𝘢𝘭 𝘮𝘰𝘯𝘪𝘵𝘰𝘳𝘪𝘯𝘨 𝘰𝘧𝘧𝘦𝘳𝘴 𝘰𝘯𝘭𝘺 𝘩𝘪𝘨𝘩-𝘭𝘦𝘷𝘦𝘭 𝘴𝘪𝘨𝘯𝘢𝘭𝘴:
• P95 latency
• Error counts
• CPU/Memory graphs
Helpful, but not enough to understand what happened to one specific request as it travels across the system.
𝗘𝗻𝘁𝗲𝗿 𝗢𝗽𝗲𝗻𝗧𝗲𝗹𝗲𝗺𝗲𝘁𝗿𝘆, 𝘁𝗵𝗲 𝗺𝗶𝘀𝘀𝗶𝗻𝗴 𝗹𝗶𝗻𝗸
During that conversation with my friend, we kept coming back to one insight: Engineering teams spend huge amounts of time reinventing ad-hoc tracing just to answer basic questions.
𝗢𝗽𝗲𝗻𝗧𝗲𝗹𝗲𝗺𝗲𝘁𝗿𝘆 (𝗢𝗧𝗘𝗟) 𝗲𝗹𝗶𝗺𝗶𝗻𝗮𝘁𝗲𝘀 𝗮𝗹𝗹 𝗼𝗳 𝘁𝗵𝗮𝘁.
✔ End-to-end distributed tracing
A single Trace ID follows a request across every microservice, queue, and function.
✔ Automatic instrumentation
It works across languages (Go, Python, Node.js, Java…) and supports HTTP, gRPC, message brokers, DB calls, cloud services, and more.
✔ Built-in correlation
Traces, logs, and metrics are tied together automatically.
You no longer have to manually match timestamps or grep logs at 3 AM.
✔ Vendor-neutral observability
Send your telemetry anywhere: Grafana Tempo, Jaeger, Datadog, New Relic, Elastic, etc.
💡 𝘞𝘩𝘺 𝘵𝘩𝘪𝘴 𝘮𝘢𝘵𝘵𝘦𝘳𝘴 𝘪𝘯 𝘢𝘯𝘺 𝘤𝘰𝘮𝘱𝘭𝘦𝘹 𝘢𝘳𝘤𝘩𝘪𝘵𝘦𝘤𝘵𝘶𝘳𝘦
Whether you’re building:
• an email ingestion/scanning pipeline
• a payment processing system
• a multi-service API backend
• a real-time data processing platform
…you need visibility into every hop of every request.
Without it, you get blind spots, long MTTR, and frustrated customers.
OTEL gives you:
🔹 Faster debugging
🔹 Clearer system behavior
🔹 Better SLAs
🔹 Happier teams and users